2025 in 2025
In 2024 I managed to get my “running mojo” back, and 2025 was the first year since Covid where I kept a streak going all year. I’m not running every day as I did in the past, but it has now been almost two years where I consistently ran at least every other day.
In 2023 I had a 50-day long break during spring and came up to a total of 888km. In 2024 I aimed at consistency – rather do a short run as long as it keeps the streak up, otherwise I’d risk falling back into a hole with another long break. I hit slightly above 1000km for 2024, and the consistency set me up for success in 2025.
My goal was really just “keep it up, maybe do a few more kilometers”. I had set up a sheet where IFTTT would automatically add new runs, so I always had an easy way to see current progress. Here’s what it looks like now that the year has ended:

The three goals I defined at the start of the year were 1111km, 1234km and 1337km – I have a thing for funny numbers. I knew 1111km would not be much of a problem, but the other two targets definitely felt like stretch goals. I did about 5.5km per run in 2024, and usually felt that I didn’t have much more gas. Going for 7 or sometimes 8km felt like pushing it.
But as you can see on the progress graph, it didn’t take long until I surpassed all three goals. The red straight line is a projection based on the average of runs in that year so far, so this one moved as I progressed – however it jumped above the goal lines early on and remained there throughout the entire year. Turns out, my limits were mostly in my head at this point. I pushed myself to do 7km or more on every run to ensure I’d be on track for the goals and realized that actually didn’t feel much more strenuous. In late January I did the first 10k again, and by April I had increased the average run distance to that (or more, very often 11.11km) as well. I managed to break 1000km on June 29th – at that point I started daring to hope that 2000km would be achievable. Considering that I had still been increasing the average distance during the first few months, all I had to do was keep up the current levels consistently.
In October I got sick and had to dramatically reduce my distance. You can see that in the graph when my real progress moves below the average projection. I wasn’t even sure I could keep up the streak, and of course I got worried that I wouldn’t be able to reach 2000km now. Not a fun time – but I was able to come back strong in November and managed to push myself hard enough in December to go for a total of 2025 (the current year counts as a funny number!) kilometers.
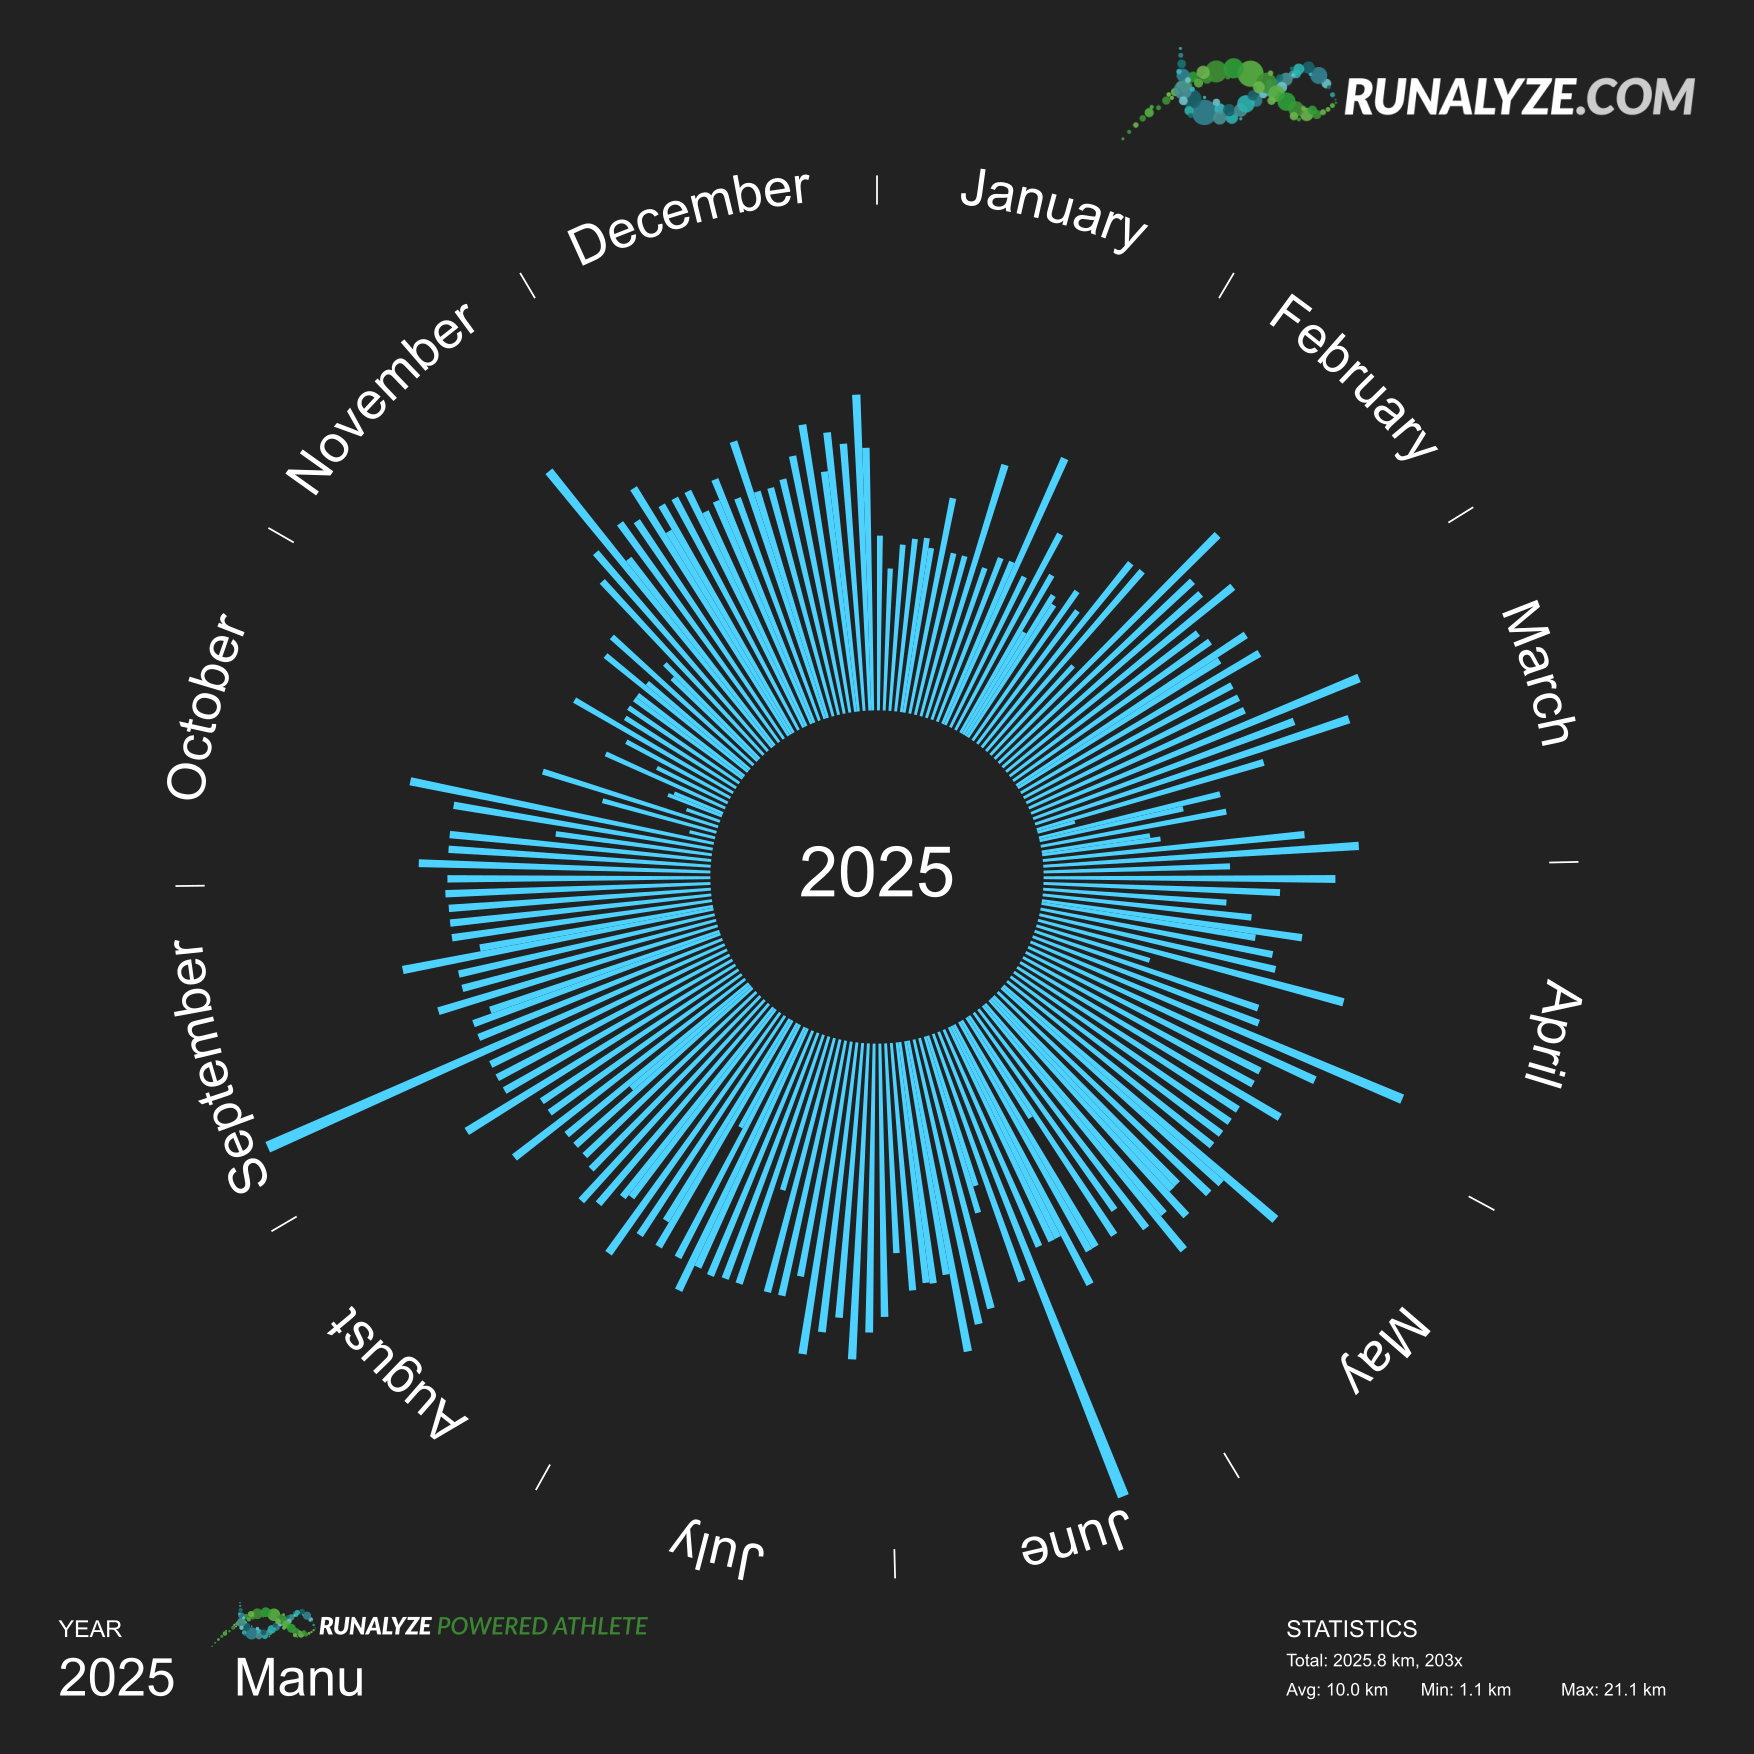
That distance accumulated over 203 runs. All but one (due to a work trip to Berlin) were at home here in Passau, and easily 90% of them on the exact same route. I sure like me some routine! That makes this animation 1 (link in case the embedded video doesn’t work) look a bit silly, but it’s still fun to watch all runs overlaid:
I created this with GPX Animator and two helper scripts: One to organize all my activity files by year, and one that uses gpsbabel to change a set of GPX files so that they all start at the same time. GPX Animator has no feature to do this natively, so I used the same approach that another user suggested. ↩︎